Overview
The Logging, Monitoring & Alerting (LMA) Collector is an advanced monitoring agent solution that should be installed on each of the OpenStack nodes you want to monitor.
The LMA Collector (or Collector for short) is a key component of the LMA Toolchain project as shown in the figure below:
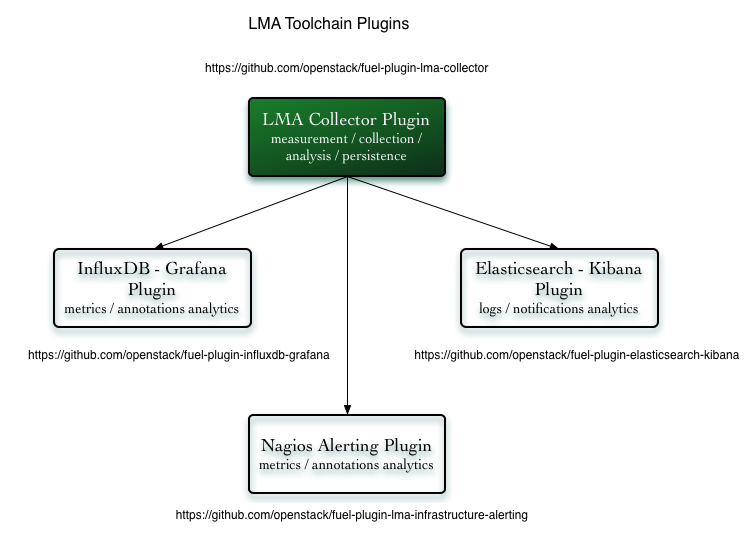
Each Collector is individually responsible for supporting the sensing, measurement, collection, analysis and alarm functions for the node it is running on.
A wealth of operational data is collected from a variety of sources including log files, collectd and RabbitMQ for the OpenStack notifications.
Note
The Collector which runs on the active controller of the control plane cluster, is called the Aggregator because it performs additional aggregation and multivariate correlation functions to compute service healthiness metrics at the cluster level.
A primary function of the Collector is to sanitise and transform the ingested raw operational data into internal messages using the Heka message structure. This message structure is used within the Collector’s framework to match, filter and route messages to plugins written in Lua which perform various data analysis and computation functions.
As such, the Collector may also be described as a pluggable framework for operational data stream processing and routing.
Its main building blocks are:
- collectd which is bundled with a collection of monitoring plugins. Many of them are purpose-built for OpenStack.
- Heka (a golang data processing swiss army knife by Mozilla) which is the cornerstone component of the Collector. Heka supports out-of-the-box a number of input and output plugins that allows the Collector to integrate with a number of external systems’ native protocol like Elasticsearch, InfluxDB, Nagios, SMTP, Whisper, Kafka, AMQP and Carbon to name a few.
- A collection of Heka plugins written in Lua to decode, process and encode the operational data.
There are three types of Lua plugins running in the Collector:
- The input plugins which collect, sanitize and transform the raw data into an internal message representation which is injected into the Heka pipeline for further processing.
- The filter plugins which execute the analysis and correlation functions.
- The output plugins which encode and transmit the messages to external systems like Elasticsearch, InfluxDB or Nagios where the data can be further processed and persisted.
The output of the Collector / Aggregator is of four kinds:
- The logs and notifications which are sent to Elasticsearch for indexing. Elasticsearch combined with Kibana provides insightful log analytics.
- The metrics which are sent to InfluxDB. InfluxDB combined with Grafana provides insightful time-series analytics.
- The health status metrics for the OpenStack services which are sent to Nagios (or via SMTP) for alerting and escalation purposes.
- The annotation messages which are sent to InfluxDB. The annotation messages contain information about what caused a service cluster or node cluster to change state. The annotation messages provide root cause analysis hints whenever possible. The annotation messages are also used to construct the alert notifications that are sent via SMTP or to Nagios.
Requirements
| Requirement | Version/Comment |
|---|---|
| Mirantis OpenStack | 8.0 |
| A running Elasticsearch server (for log analytics) | 1.7.4 or higher, the RESTful API must be enabled over port 9200 |
| A running InfluxDB server (for metric analytics) | 0.10.0 or higher, the RESTful API must be enabled over port 8086 |
| A running Nagios server (for infrastructure alerting) | 3.5 or higher, the command CGI must be enabled |
Limitations
- The plugin is not compatible with an OpenStack environment deployed with Nova-Network.
- The Elasticsearch output plugin of the Collector is configured to use the drop policy which implies that the Collector will start dropping the logs and the OpenStack notifications when the output plugin has reached a buffering limit that is currently set to 1GB by default. This situation can typically happen when the Elasticsearch server has been inaccessible for a long period of time. This limitation will be addressed in a future release of the LMA Collector Plugin.
- When you re-execute tasks on deployed nodes using the Fuel CLI, hekad and collectd services will be restarted on these nodes during the post-deployment phase. See bug #1570850 for details.