Configuration Guide
Plugin configuration
To configure your plugin, you need to follow these steps:
- Create a new environment with the Fuel web user interface.
- Click on the ‘Settings’ tab of the Fuel web UI and select the ‘Other’ category.
- Scroll down through the settings until you find the ‘The Logging, Monitoring and Alerting (LMA) Collector Plugin’ section. You should see a page like this.
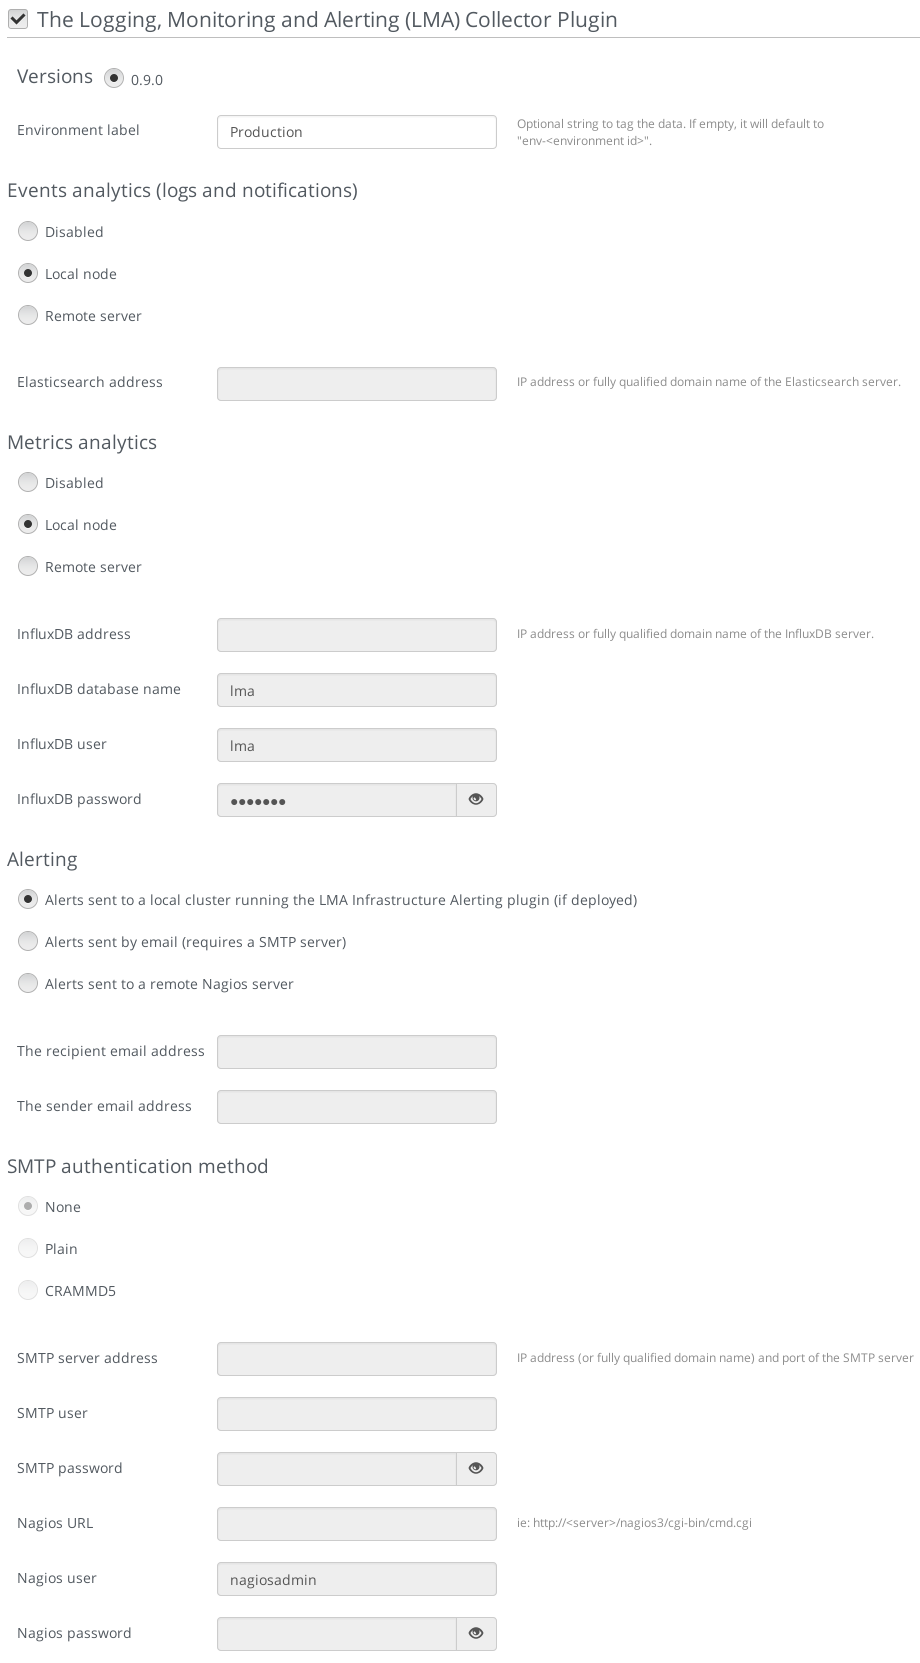
- Tick the ‘The Logging, Monitoring and Alerting (LMA) Collector Plugin’ box and fill-in the required fields as indicated below.
- Provide an ‘Environment Label’ of your choice to tag your data (optional).
- For the ‘Events Analytics’ destination, select ‘Local node’ if you plan to use the Elasticsearch-Kibana Plugin in this environment. Otherwise, select ‘Remote server’ and specify the fully qualified name or IP address of an external Elasticsearch server.
- For the ‘Metrics Analytics’ destination, select ‘Local node’ if you plan to use the InfluxDB-Grafana Plugin in this environment. Otherwise, select ‘Remote server’ and specify the fully qualified name or IP address of an external InfluxDB server. Then, specify the InfluxDB database name you want to use, a username and password that has read and write access permissions.
- For ‘Alerting’, select ‘Alerts sent by email’ if you want to receive alerts sent by email from the Collector. Otherwise, select ‘Alerts sent to a local cluster’ if you plan to use the Infrastructure Alerting Plugin in this environment. Alternatively, you can select ‘Alerts sent to a remote Nagios server’.
- For ‘Alerts sent by email’, you can specify the SMTP authentication method you want to use. Then, specify the SMTP server fully qualified name or IP address, the SMTP username and password who have the permissions to send emails.
- Finally, specify the Nagios server URL, username and password if you have chosen to send alerts to an external Nagios server.
- Configure your environment as needed.
- Assign roles to the nodes for the environment.
- Verify networks on the Networks tab of the Fuel web UI.
- Deploy your changes.
Note
The LMA Collector Plugin is a hot-pluggable plugin which means that it is possible to deploy the LMA Collector in an environment that is already deployed. To deploy the LMA Collector in an environment that is already deployed, you need to run the command below from the Fuel master node, for every OpenStack node of the current deployment:
[root@nailgun ~]# fuel nodes --env <env_id> --node <node_id> --deploy
Plugin verification
Once the OpenStack environment is ready, you may want to check that both the ‘collectd’ and ‘hekad’ processes of the LMA Collector are running on the OpenStack nodes:
[root@node-1 ~]# pidof hekad
5568
[root@node-1 ~]# pidof collectd
5684
Troubleshooting
If you see no data in the Kibana and/or Grafana dashboards, use the instructions below to troubleshoot the problem:
Check if the LMA Collector service is up and running:
# On the controller node(s)
[root@node-1 ~]# crm resource status lma_collector

# On non controller nodes
[root@node-1 ~]# status lma_collector
If the LMA Collector is down, restart it:
# On the controller node(s)
[root@node-1 ~]# crm resource start lma_collector

# On non controller nodes
[root@node-1 ~]# start lma_collector
Look for errors in the LMA Collector log file (located at /var/log/lma_collector.log) on the different nodes.
Look for errors in the collectd log file (located at /var/log/collectd.log) on the different nodes.
Check if the nodes are able to connect to the Elasticsearch server on port 9200.
Check if the nodes are able to connect to the InfluxDB server on port 8086.